Welcome to the bamboo documentation!

bamboo is an application that systematizes realtime data analysis. bamboo provides an interface for merging, aggregating and adding algebraic calculations to dynamic datasets. Clients can interact with bamboo through a REST web interface and through Python.
bamboo supports a simple querying language to build calculations (e.g. student teacher ratio) and aggregations (e.g. average number of students per district) from datasets. These are updated as new data is received.
bamboo uses pandas for data analysis, pyparsing to read formulas, and mongodb to serialize data.
bamboo is open source software released under the 3-clause BSD license, which is also known as the “Modified BSD License”.
http://bamboo.io hosts bamboo for demonstration purposes only. Do not put critical data here, it may be deleted without notice.

REST API Usage
Formula Reference
Code Structure
Python Library Usage
Dependencies
- python (tested on version 2.7)
- mongodb (make sure to install the latest packages from 10gen, not what might be in your default pkg manager):
for numpy, pandas, and scipy:
On Arch Linux: # pacman -S blas lapack gcc-fortran.
On Debian based: # apt-get install gfortran libatlas-base-dev.
Installation
$ pip install bamboo-server
Python pip package for bamboo.
For creating plots: $ pip install matplotlib.
Usage
import bamboo as bm
# Turn asyncronous processing off
bm.set_async(False)
url = 'http://formhub.org/mberg/forms/good_eats/data.csv'
dataset = bm.Dataset.create()
dataset.import_from_url(url, na_values=['n/a'])
dataset.schema
>>> {u'_gps_altitude': {u'cardinality': 14, u'label': u'_gps_altitude', ...
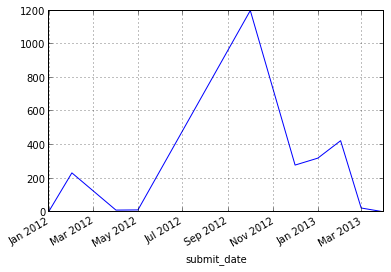
# Resample monthly, 'M', aggregating by mean
date_column = 'submit_date'
monthly = ds.resample(date_column, 'M', 'mean').set_index(date_column)
monthly_amounts = monthly.amount.dropna()
# Plot the amount spent per month
mothly_amounts.plot()