Plotting
REST end-point:
http://bamboo.io/datasets/[DATASET ID]/plot
View the documentation for the query parameters
accepted by the plot end point.
Kenyan school teaching staff by province
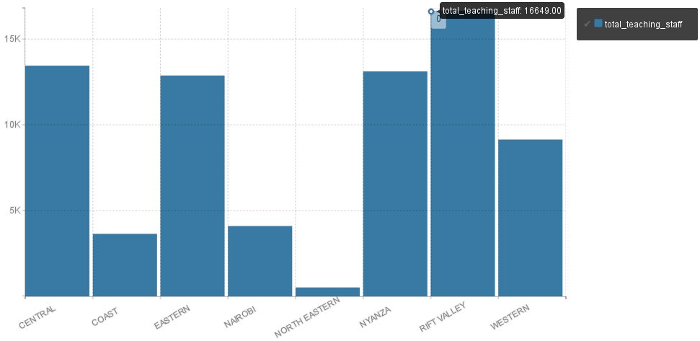
Click for an interactive version.
Note
Chart parameters
- select =
{"total_teaching_staff":1}- Choose only the column
total_teaching_staff.
- Choose only the column
- group =
province- Group on the dimensional column
province.
- Group on the dimensional column
- plot_type =
bar- Format the plot as a bar plot.
Meal cost grouped by rating over time

Click for an interactive version.
Note
Chart parameters
- select =
{"amount":1}- Choose only the column
amount.
- Choose only the column
- group =
food_type- Group on the dimensional column
food_type.
- Group on the dimensional column
- index =
submit_date- Set the date column
submit_dateas the temporal index column.
- Set the date column
- query =
{"amount": {"$lt": 400}, "submit_date": {"$gt": "2012-12-09"}}- Restrict the data to dates after December 9th 2012, and to amounts less than 400.
- plot_type =
area- Format the plot as an area plot.